Click on a stock to view its price chart and trend quality information.
Bracketed numbers are the overall trend quality rankings five days ago.
Trend Quality Rankings
The trend is your friend. But not all trends are equal. The trend quality rankings seek to identify the best price trends. That is, the price trends which are the most sustainable and are likely to persist into the future.
Each stock is ranked across three timeframes: short, medium and long-term. The short-term rankings evaluate price action over the past 50-days. The medium-term rankings evaluate price action over the past 100-days, and the past 200-days for the long-term rankings.
For each timeframe, stocks are ranked based on five price metrics:
1.) Percentage Price Change
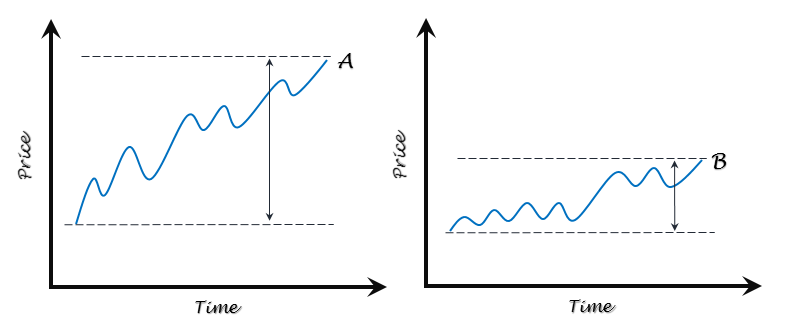
Stocks are ranked by their percentage price change over each timeframe. All else equal, a stock with a larger percentage price change (stock A) will have a higher ranking than a stock with a lower percentage price change (stock B).

2.) Days Above Simple Moving Average
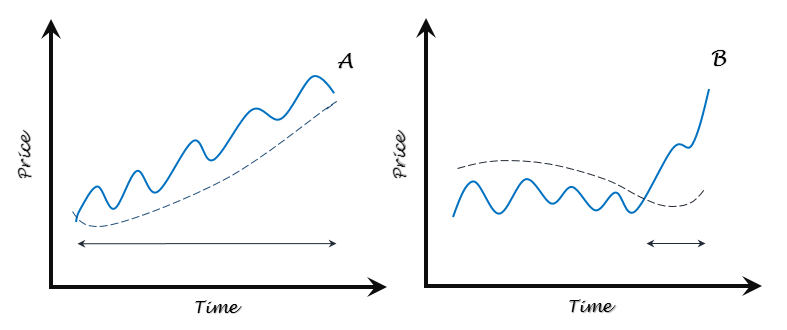
Stocks are ranked by how many consecutive days their price has been above/below their respective short (50-days), medium (100-days) and long-term (200-days) simple moving averages. All else equal, a stock whose price has been above its simple moving average for longer (stock A) will have a higher ranking than a stock whose price has been above its simple moving average for a shorter period.

3.) Price Efficiency
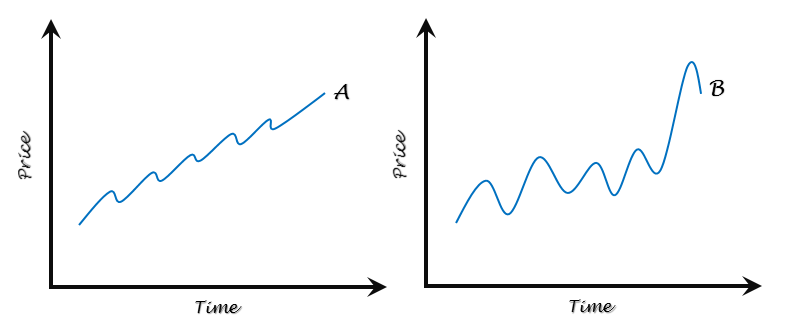
Stocks are ranked by how efficiently their price has behaved over each timeframe. The Kaufman Efficiency Ratio is used to measure how erratic each stock has performed. All else equal, a stock which has performed less erratically (stock A) will have a higher ranking than a stock which has behaved more erratically (stock B).

4.) Price Percent Rank
Stocks are ranked by their percent rank over each timeframe. Percent rank compares the final price of a stock to its price trading range. All else equal, a stock whose final price is in the higher part of its trading range (stock A) will have a higher ranking than a stock whose final price is in the lower part of its trading range (stock B).

5.) Maximum Drawdown
Stocks are ranked by their maximum price drawdown over each timeframe. All else equal, a stock which has experienced a smaller price drawdown (stock A) will have a higher ranking than a stock with a larger price drawdown (stock B).

Stocks are ranked across the five metrics above and those rankings are used to calculate an aggregate trend quality ranking for each timeframe. Additionally, an overall trend quality ranking is calculated for each stock, based on the individual rankings across all timeframes.
